Honeycomb for Kubernetes
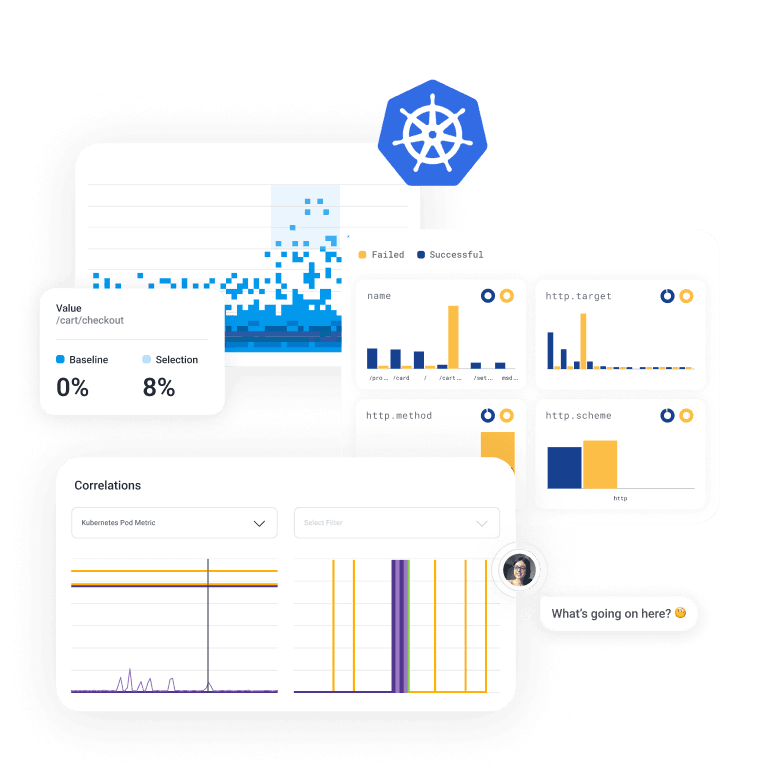
Solve application mysteries in seconds. Effortlessly explore correlations between Kubernetes metrics, user behavior, and code performance to root out the causes of failures.

The Honeycomb Difference
Honeycomb for Kubernetes helps engineering teams see everything and debug intuitively—all while keeping costs manageable.

Powered by OpenTelemetry, refined for relevance
Honeycomb for Kubernetes works with any language, node, and cluster, with instrumentation paths that capture the most relevant context. Use our OpenTelemetry docs to light up your core services with metrics, events, and trace spans. For legacy services, capture network traffic from your entire orchestration layer without changing your code or deployment manifest.

Scale your cluster, not your bill
Purchase Honeycomb through the AWS Marketplace to make getting started faster and easier by using the AWS Marketplace Standard Contract and AWS’ billing and EDP credits. See our marketplace page or explore a Marketplace Private Offer with our sales team.

Intuitive, human-driven investigation
Unlike other dashboards, Honeycomb supplements cluster health reports with a query-driven approach to pinpoint what's wrong and how Kubernetes is involved. Filter any board by specific Kubernetes context in your traces. When you’re navigating unfamiliar services, our AI-powered Query Assistant turns plain English questions into relevant queries and provides immediate visual feedback.
The out-of-the-box templates for metric analysis and correlation really help put together a more holistic picture of our environments, simplifying our workflow and eliminating the need to compare across observability platforms.

Harry Morgan
Senior DevOps Engineer, Birdie